Fundamental Analysis
Fundamental analysis is one of the cornerstones of investing, and gives you tools to help determine the value of different investments. From SWOT analysis to PE ratios, learn the tools of fundamental analysis here.
Basics of Fundamental Analysis


-
What is the difference between qualitative and quantitative fundamental analysis?
Quantitative fundamental analysis analyzes an investment according to easily measured factors, such as the earnings or assets of the company that issued a stock. Qualitative analysis looks at harder to measure factors such as the quality of a company’s management or the strength of its brand. There is not a hard line between the two and some factors can fall into both categories.
-
What is the difference between fundamental analysis and technical analysis?
Fundamental analysis looks to see whether an investment is overvalued or undervalued based on underlying economic conditions, as well as the finances of the company or other organization that issued a stock or bond. Technical analysis instead looks at patterns in the price of an investment to predict future movements in that investment’s price.
-
Why do investors read financial statements when doing fundamental analysis?
Financial statements contain many of the key metrics that help investors determine if a company is undervalued or overpriced. Financial statements have a company’s level of profitability, how much it holds in different types of assets, as well as how fast its sales and profits have grown over time. All of these figures are core parts of determining if a company is properly valued.
Learn More: How Do I Read and Analyze an Income Statement? -
What is a good PE ratio for a stock?
There is no one answer to this question as different companies will naturally have different PE ratios. For example, mature companies in defensive stock sectors generally have low PE ratios, while early stage companies or companies in fast-growing sectors often have very high PE ratios. To make the most of PE ratio as a metric of company value, make sure to compare PE ratios to similar companies in similar sectors, as well as to the same company at different periods in the past to get better comparisons.
-
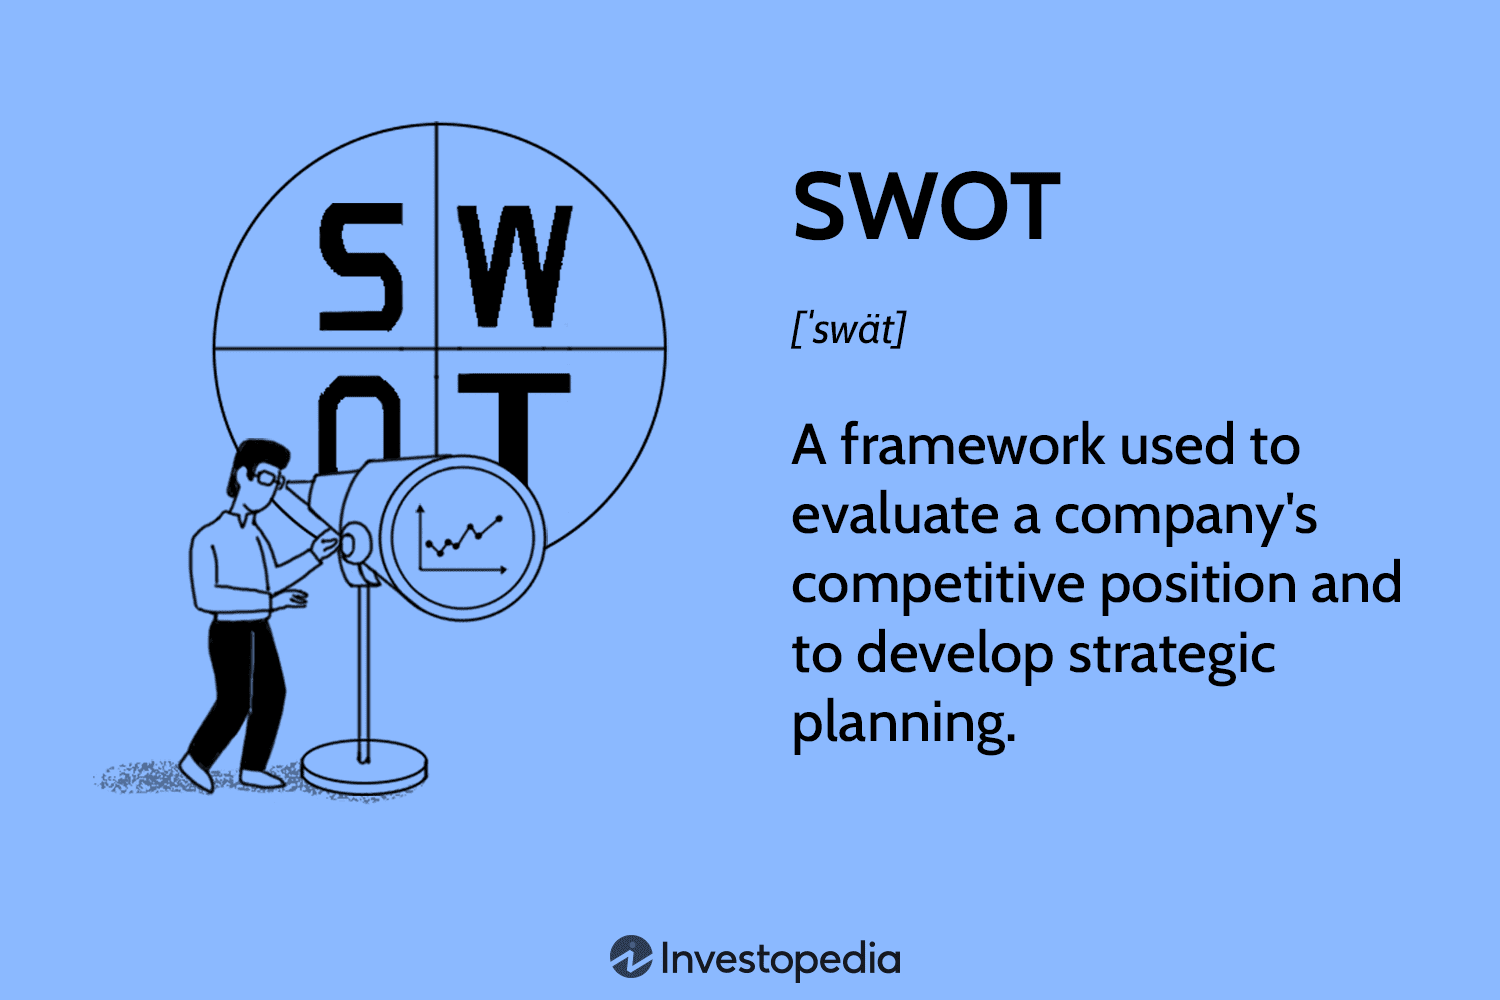
Strength, Weakness, Opportunity, and Threat (SWOT) Analysis
SWOT analysis is a qualitative analysis method for analyzing a company’s competitive position. It is meant to help figure out how a company can best take advantage of opportunities in its market
-
Securities and Exchange Commission (SEC) Form S-1
An S-1 is the SEC registration form filed by companies seeking to become publicly traded in the U.S. It contains important information for investors seeking to invest in newly public companies.
-
Securities and Exchange Commission (SEC) Form 10-K
A 10-K is an annual financial report the SEC requires all publicly traded companies in the U.S. to file. 10-K’s are a valuable source of informations for investors seeking to analyze a company.
-
Price-to-Earnings (P/E) Ratio
PE ratio is the ratio of a company’s stock price to its earnings per share. Value investors commonly use it as one way to measure if a company is undervalued.
-
Fundamentals
The fundamentals of an investment refer to the underlying factors that contribute to the price of an investment. Examples of these include the cash flow of a government who issued a bond or the profitability of a company whose stock you own.
-
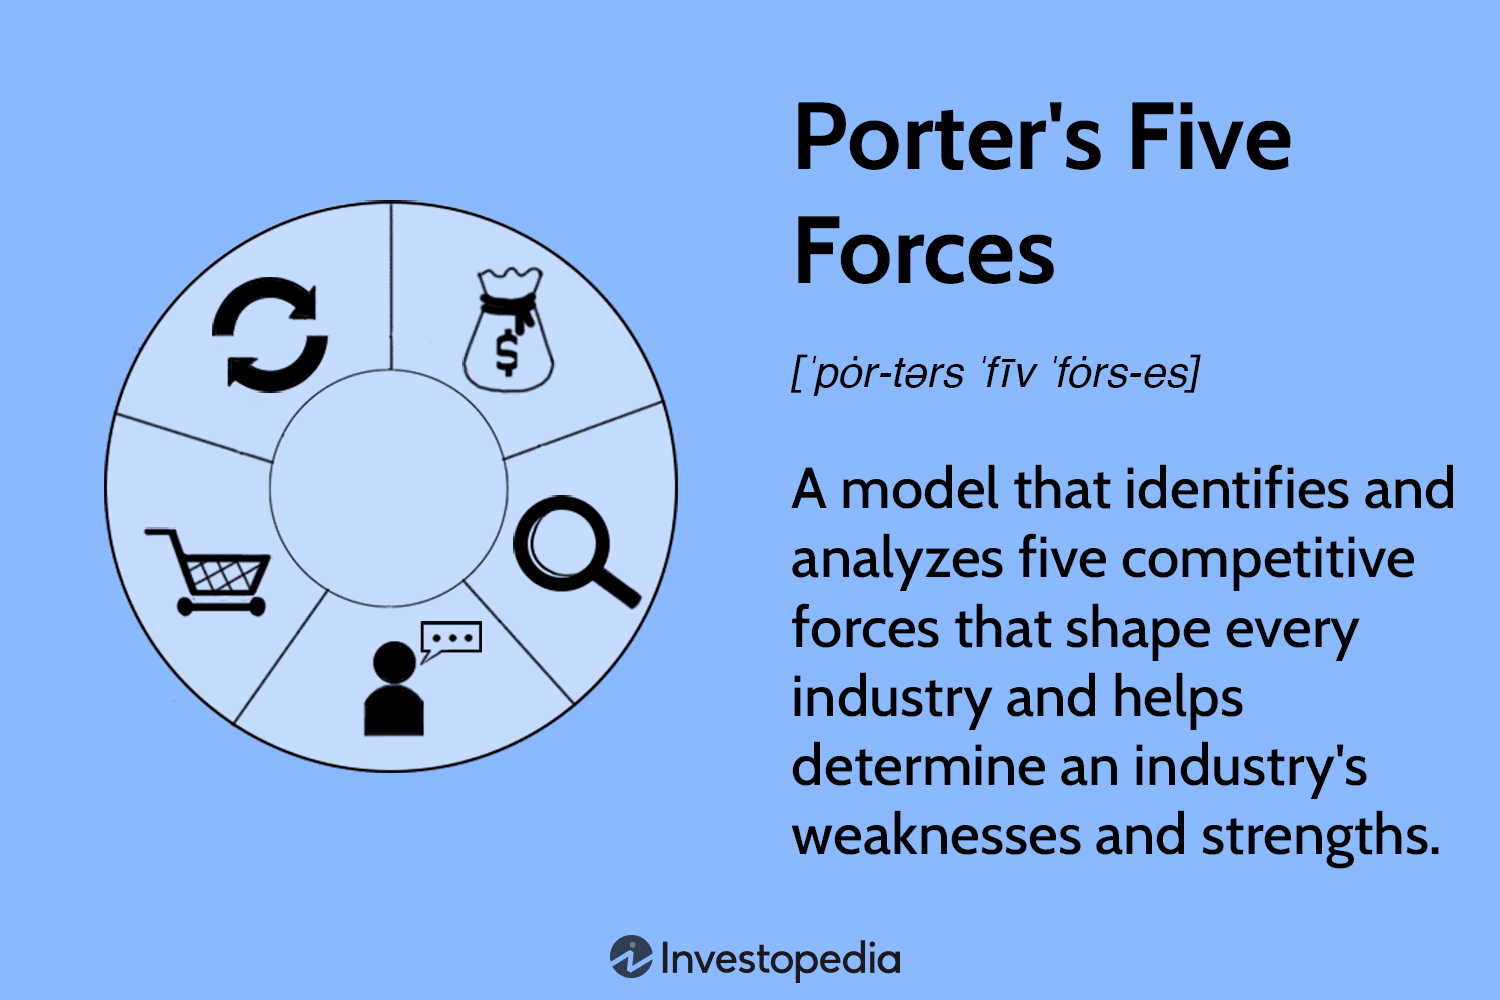
Porter's 5 Forces
Porter’s Five Forces is a fundamental analysis model for analyzing a company’s place within its industry or sector. The five forces are: competition in the industry, potential of new entrants into the industry, power of suppliers, power of customers, threat of substitute products.
-
Value Investing
Value investing seeks to invest in companies trading for less than what their underlying fundamental metrics indicate they are worth. This is usually done by using fundamental or quantitative analysis strategies.
-
Macro Environment
The macro environment refers to the broader economic conditions affecting the performance of an investment or a company. This can include factors such as inflation, unemployment, and place in the business cycle.


Explore Fundamental Analysis


:max_bytes(150000):strip_icc()/beautiful-beach-background-for-summer-travel-with-sun-coconut-tree-and-beach-wooden-bed-on-sand-with-beautiful-blue-sea-and-blue-sky-summer-mood-sun-beach-background-concept-621034054-583ecf4b3df78c6f6a396ae9.jpg)


:max_bytes(150000):strip_icc()/abstract-financial-chart-with-red-color-3d-downtrend-line-arrows-go-down-with-dollar-sign-on-yellow-color-background-1094830144-d1bdd916c31a4cefb5007838519c1107.jpg)


:max_bytes(150000):strip_icc()/businessman-checking-stock-market-on-digital-tablet-and-a-desktop-computer-with-stock-exchange-graph-on-screen--financial-stock-market--analyzing-data-in-office-background--1150204868-1b4119fe950440e28d4b695a0276558a.jpg)